Seeing the Forest from Above
How a Good Map can be a Game-Changer for Old-Growth Forest Conservation
Editor’s Note: The work that John Hagan and his colleagues are doing in Maine is a huge step in moving us toward protecting late-successional and old-growth forest (LSOG). The age-old questions of where it is and how much there is are suddenly so much easier to answer with the group’s application of new imaging. Ben Shamgochian presented this work at the recent Northeastern Old Growth Conference, and the audience was rapt. The best news is that the work has inspired legislation to protect these special places. Stay tuned for news of the next Old Growth Conference, where we’ll learn more about this important work. – Liz Thompson
In June 2022, we were replicating a birds-and-forestry study we originally conducted in the early 1990s in the unorganized territories of northern Maine. Much had changed about Maine’s commercial forest in the intervening decades. Clearcutting is much less common today, partly because of public outrage over clearcutting in the 1990s. The reduction of clearcutting, however, meant that more acres of forest were harvested with partial cutting each year, resulting in a vast forest landscape in a constant state of disturbance. Also, softwood (spruce and fir) were the desired species in the early 1990s for papermaking. Today, due to changes in technology, hardwood is preferred. With the backdrop of continued continental declines in bird populations, we wanted to know what these changes in Maine’s commercial forest might mean for regional and national bird conservation. The 10 million acres of unorganized townships (places without enough people to form a local government) were no small chunk of bird habitat, even on a national scale.
The results were surprisingly good news. Although a few bird species had declined since the 1990s (e.g., Winter Wren, Blackburnian Warbler, Lincoln’s Sparrow), most had increased. Rarely do we get good news about biodiversity, but this was one of those occasions. It appeared the Maine North Woods was functioning like one big bird sanctuary for the nation.
But we made another discovery in 2022—that Light Detection and Ranging (LiDAR) could locate late-successional and old-growth (LSOG) forest with uncanny precision. We did not have LiDAR in the original 1990s bird study. Now we did. And it was showing us exactly where the remaining old forest stands were in an otherwise heavily harvested landscape. LiDAR helped us stratify our bird study plots across all forest age classes. On the computer, LSOG forests lit up like a neon sign in LiDAR (Figure 1).
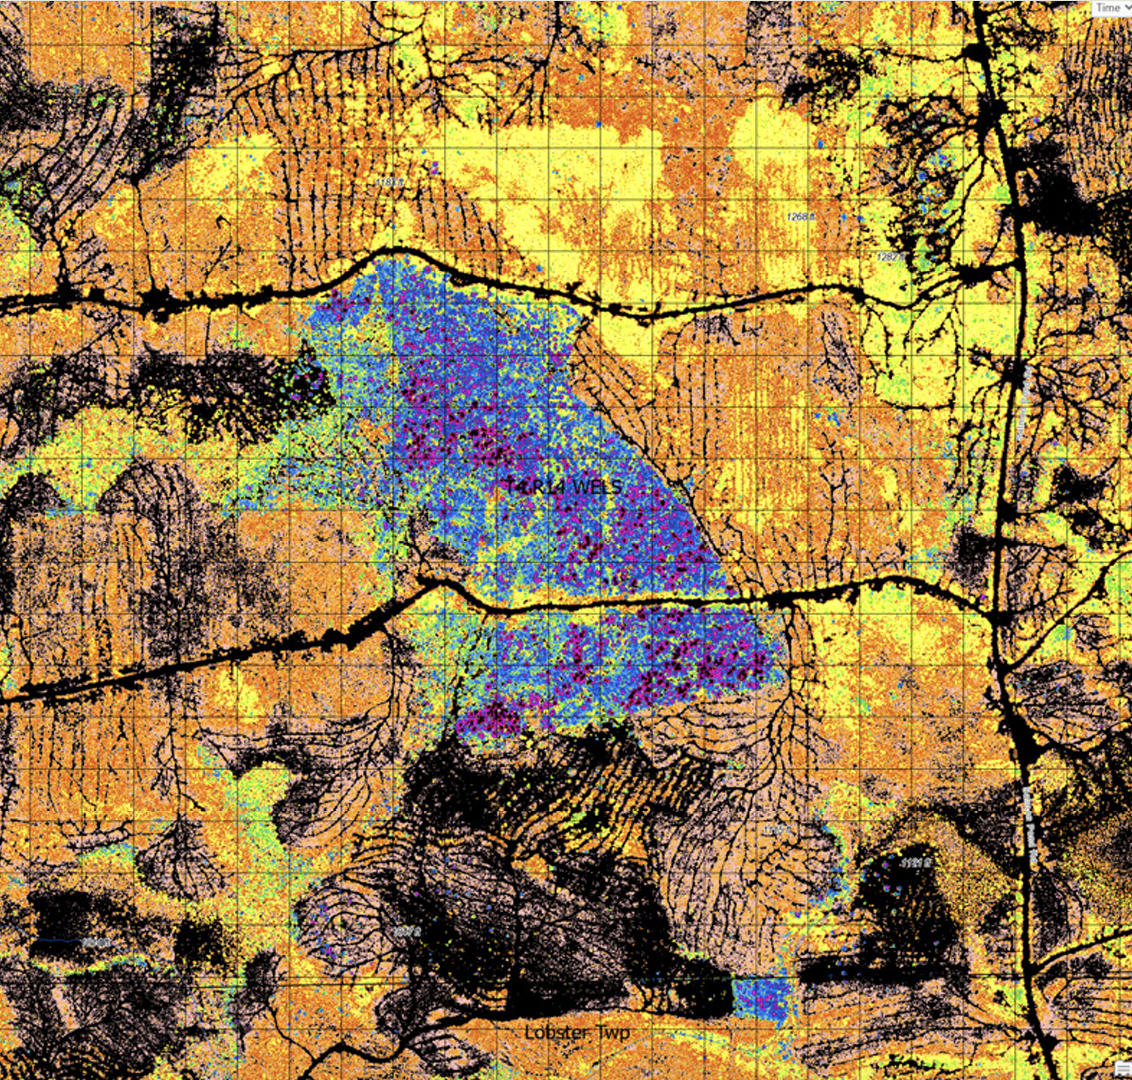
LiDAR seemed like magic to us. But it’s only physics. A laser beam is fired at the ground from a plane—several thousand pulses per second. The beam bounces off everything it hits and is reflected back to a sensor on the plane. The time it takes the laser beam to return to the plane indicates exactly how far away a surface (i.e., the ground) is, resulting in a topographic map with vertical precision of a few inches.
For the purpose of making such accurate topographic maps, trees are a problem. They’re in the way of the laser beam. But for a forest ecologist, this cartographer’s nuisance is a gold mine of information. Even with trees in the way, some of the thousands of laser pulses make it to the ground. But other pulses bounce off the tip top of the tree and all the branches below. The result is an exquisite three-dimensional view of the forest.
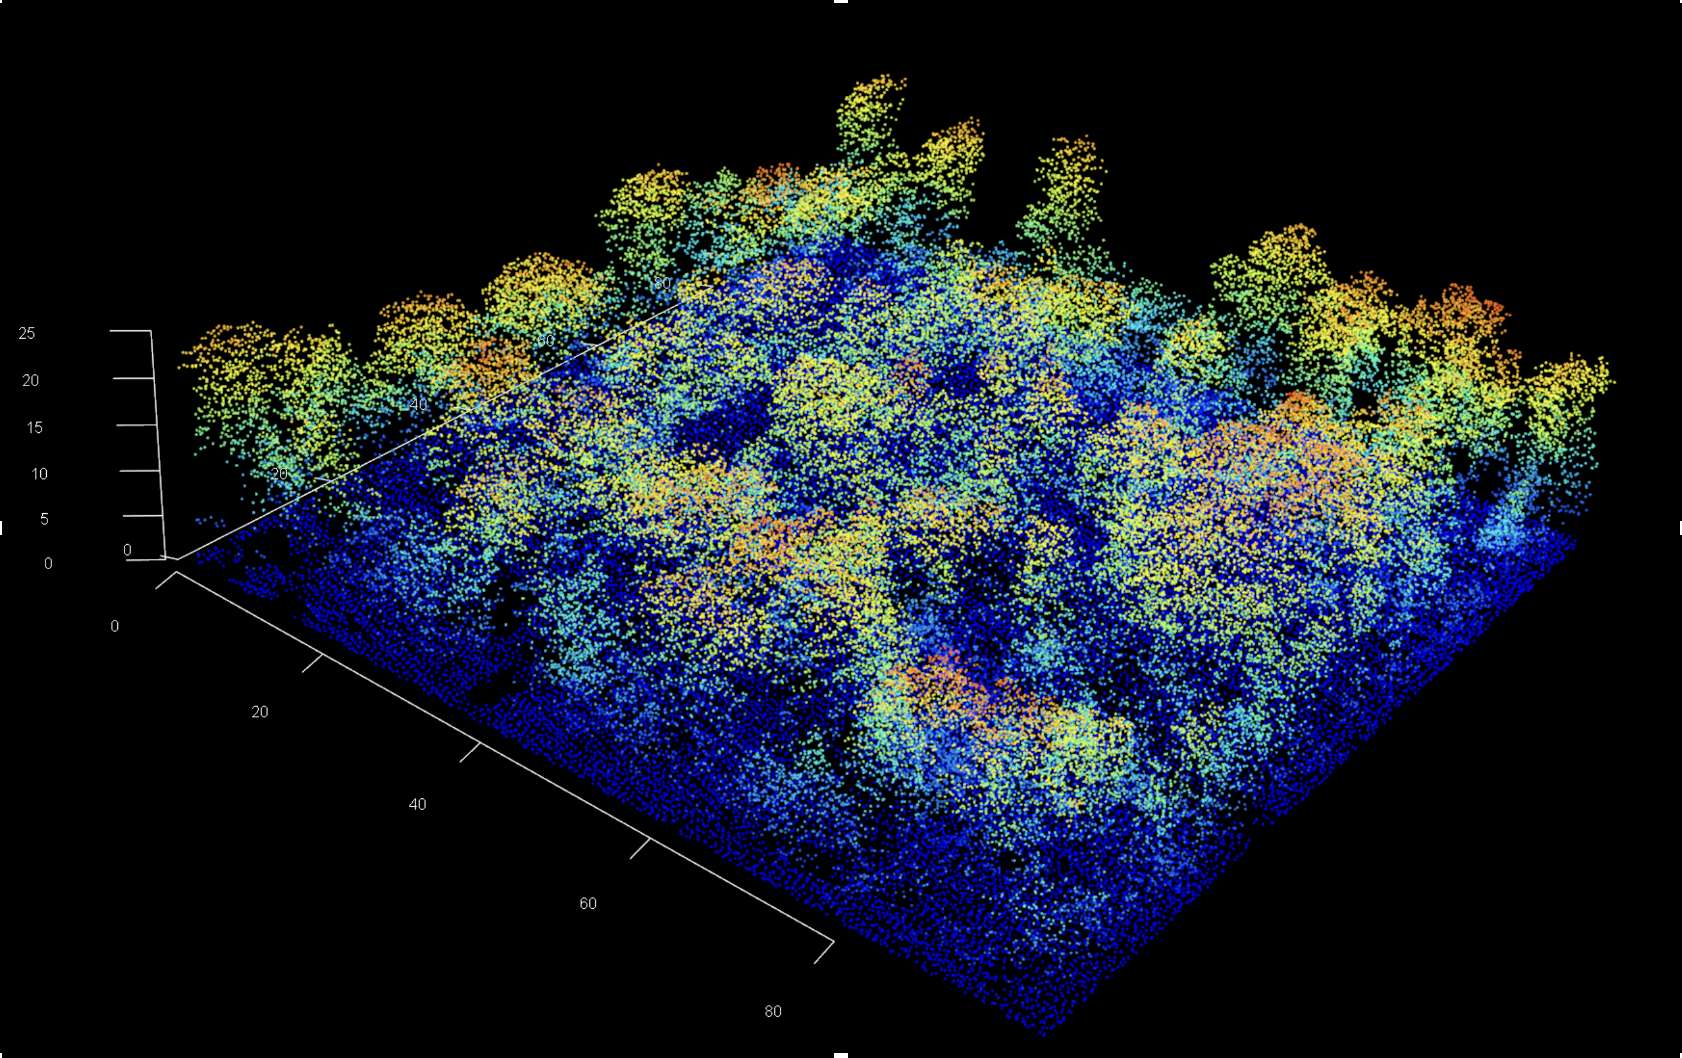
The LiDAR “point cloud” for one hectare of old-growth forest in Big Reed Reserve, T8 R10 township, Maine. There are some 125,000 points that make up this image. The irregularity of the canopy surface of old-growth forest is readily visible to the human eye, and to the computer. Image courtesy of Our Climate Common
Forest ecologists have long known that the three-dimensional structure of old-growth forest is different from even mature forest. In an old-growth forest, trees become old enough to fall over from natural causes. They create gaps in the canopy that are detectable with LiDAR. As the bird study completed, we wondered whether we could map late-successional and old-growth (LSOG) forest for the entire 10 million acres of unorganized territory of Maine using existing, publicly available LiDAR.
The short answer is “we can and we did.” In October 2024, we published our results in a report titled Using LiDAR to Map, Quantify, and Conserve Late-Successional Forest in Maine. We now know how much LSOG forest there is, where it is, who owns it, and how fast we’re losing it. Having such an accurate map is a game-changer for LSOG conservation. Before, conservationists relied primarily on word-of-mouth communication about where LSOG forest might be. There was simply no way to ground truth 10 million acres of forest on foot.
We found that only about 3.9 percent of the 10 million acres was in what we called a late-successional or old-growth-like condition. There was another 15 percent in “transitioning late-successional”—forest that would become late-successional in another 25–50 years, if not harvested. We also discovered that we were losing remaining LSOG at a rate of about 1.4 percent per year. At that rate, half would be gone in the next 30 years. In fact, we estimated that 37,000 acres of LSOG had been harvested just since 2016. Only about 20 percent of remaining LSOG was secure, in so-called “GAP 1 and 2” forest—forest in reserves and off-limits to harvesting. That leaves 80 percent vulnerable to future loss. The good news is, thanks to LiDAR, we know exactly where it is, and so we can do something about it.
Unlike satellite imagery, which usually has a resolution of 30x30 meters (98x98 feet), LiDAR can generate a detailed 1x1 meter resolution image of the forest canopy surface. The crown shape of an individual tree is easily discernable. Therefore, LiDAR can see individual natural treefall gaps, a signature of LSOG forest. We even discovered that LiDAR can see through the canopy and map big logs on the forest floor, another structural diagnostic of LSOG forest.
Because of the high resolution of LiDAR, we were also able to see very small patches of LSOG forest. Our minimum mapping unit was one hectare (2.47 acres). We found a 700-acre contiguous tract of true old growth (no evidence of human activity) that no one seemed to know about (Figure 3). The tract is on private commercial timberlands and, for now, is not in near-term (5-year) harvest plans. In my view, this extraordinary stand should never be cut, and society should find a way to conserve it.
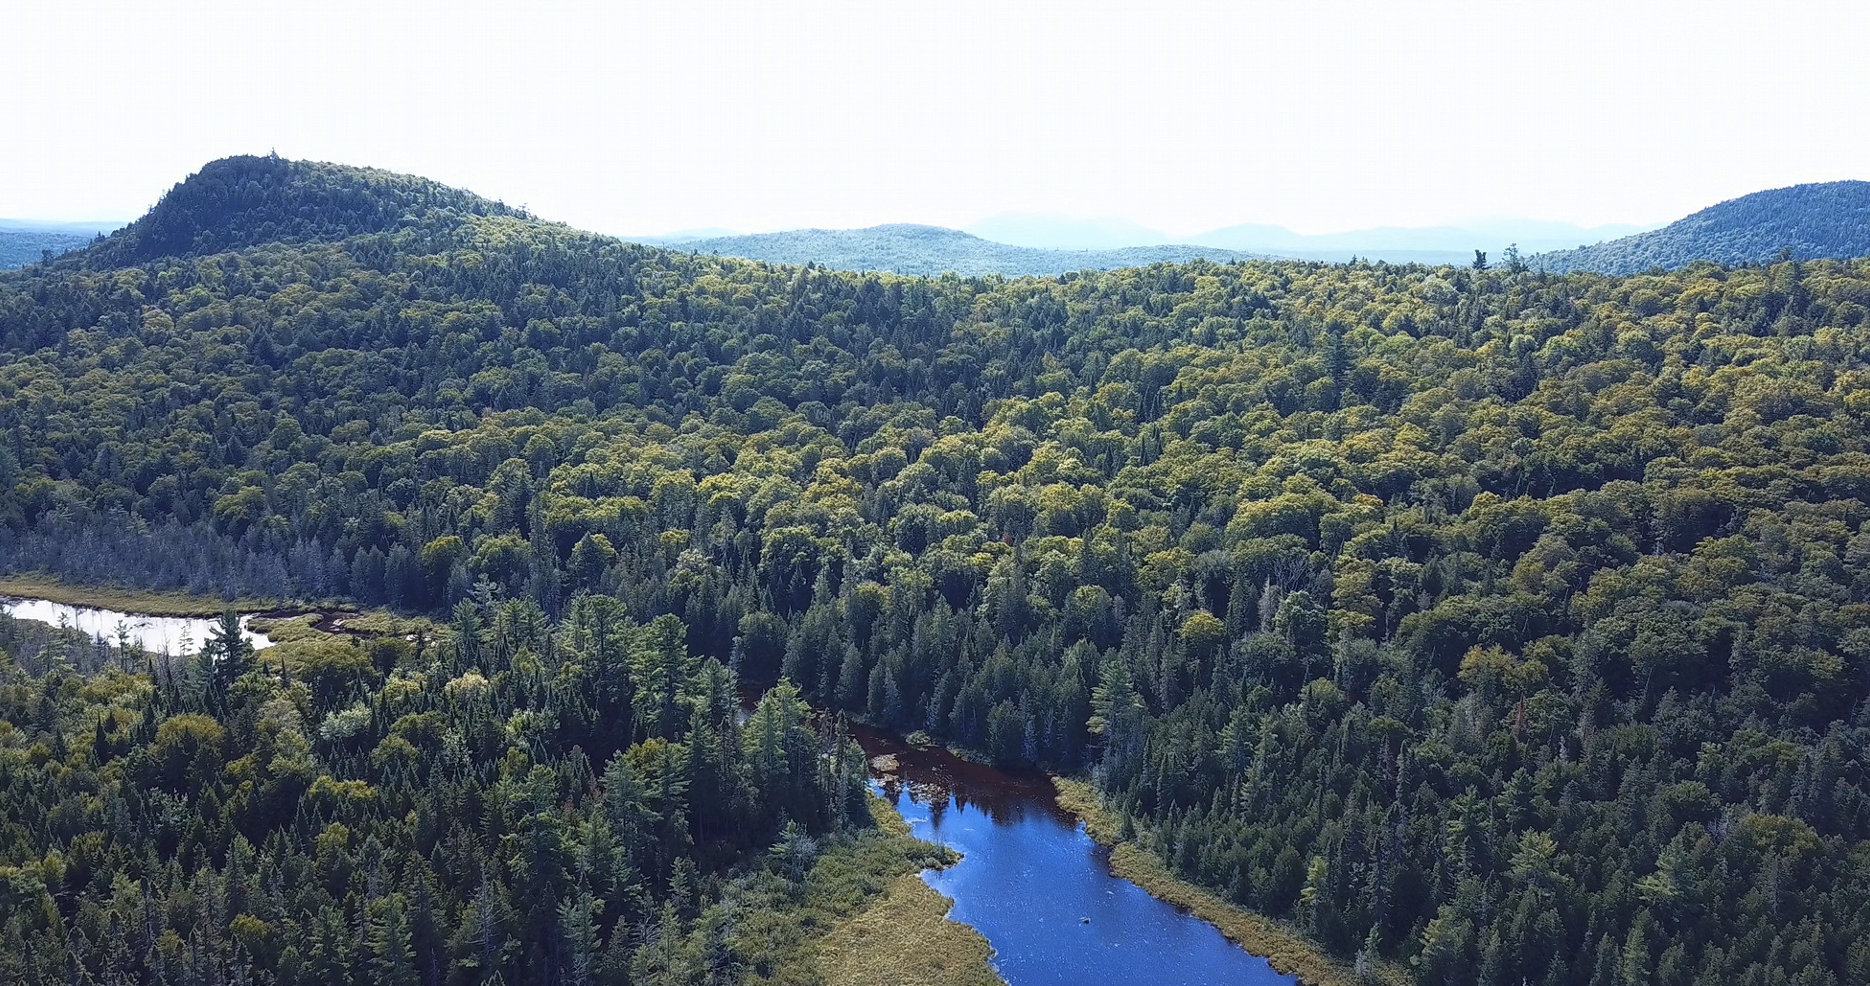
A previously unknown 700-acre tract of true old growth we discovered with LiDAR. Image courtesy of Our Climate Common
Harder to conserve will be the thousands of small, widely dispersed, 2- to 10-acre patches of LSOG forest sprinkled like shards across the unorganized territories. Conventional conservation wisdom has been that “bigger is always better.” This is wrong-minded from a biodiversity conservation perspective. Big is good. But small patches of LSOG forest are capable of harboring some of the most sensitive forest species—lichens and mosses—over the long term. These patches are small but vital lifeboats of biodiversity. They will be critical inocula for restoring forest biodiversity across the landscape, should that ever be a societal goal. The species these small patches harbor don’t need much area to survive, but they need stability. Arguably, several dozen small LSOG patches in a 25,000-acre township could be more important than a single large tract for restoring a landscape. Whether a small patch or a large tract, LiDAR tells us exactly where it all is.
We are not the first to use LiDAR to map LSOG forest, although it is a relatively new tool in forest conservation. In recent years LiDAR has been used to map LSOG forest in British Columbia, Quebec, Ukraine, Germany, the United Kingdom, and the tropics. Scientists like us are just beginning to understand what LiDAR can reveal.
LiDAR is not perfect. It can make mistakes. However, we field-checked LiDAR’s classification of the forest and it was correct over 90 percent of the time. This is an extraordinary statistic given that the only way we could find LSOG before was word-of-mouth and searching on foot. Still, even with this high accuracy, we encourage anyone who uses our LSOG map to verify the classification on the ground before making management or conservation decisions. To help with that task, we developed an LSOG Rapid Assessment Protocol (RAP) that foresters or field biologists can use in the field to validate the map. The RAP only takes about 20 minutes to complete.
Another limitation is that our LSOG model cannot be applied to stunted, high-elevation, old forest at this time. This forest type makes up very little of the unorganized townships, and moreover, it is not as vulnerable to harvesting as the 96 percent of the landscape that we evaluated. Using known areas of old, high-elevation forest, we could train the computer to find that type as well.
The science of LiDAR is amazing. But what are we going to do with this science? Will it sit on the proverbial shelf, or will people use it to conserve LSOG forest? Remarkably, it is already being put to use.
“Conventional conservation wisdom has been that “bigger is always better.” This is wrong-minded from a biodiversity conservation perspective.”
Land trusts and conservation organizations immediately put our LSOG map to use. We’ve shared it with more than 10 land trusts for areas they are considering purchasing or easing, including Maine Mountain Collaborative, Appalachian Mountain Club, Trust for Public Land, Forest Society of Maine, Maine Appalachian Trail Land Trust, Northeast Wilderness Trust, Rangeley Lakes Heritage Trust, and others. The LSOG map helps them see an important ecological dimension of the parcel of interest that they did not have before. If intended as an easement, land trusts can negotiate with the landowner to protect remaining LSOG stands. If a purchase, they can make sure these stands are not harvested prior to sale.
Of course, commercial forest landowners are interested in the LSOG map too. Most commercial forest landowners in Maine are certified sustainable under either the Forest Stewardship Council (FSC) or Sustainable Forestry Initiative (SFI). Although FSC is the more explicit of the two in terms of old-growth protection, SFI also requires its participants to conserve areas of high conservation value. Any ecologist would agree that late-successional or old-growth stands in our LSOG classification system are stands of high conservation value. We have sent all major commercial landowners our LSOG map for their ownership. We have also informed all the third-party certification auditors that the LSOG map exists. During certification audits, auditors are engaging landowners on how they are using the map. Before, no one had a map of LSOG stands, so there was little that certification could do to protect what couldn’t be seen.
The most profound policy outcome of this research is L.D. 1529, “An Act to Enhance the Protection of High-value Natural Resources Statewide.” Passed by the Maine legislature in June 2025, this legislation was spearheaded by the Natural Resources Council of Maine (NRCM) just months after our LSOG map became available. NRCM knew that having a map could prompt a larger social conversation about how much LSOG we want and how we want it distributed across the Maine landscape. L.D. 1529 calls for a statewide inventory of LSOG forest and development of mechanisms to conserve it, including payments to landowners. For the first time, LSOG conservation is public policy in Maine.
To be clear, all of these actions are just getting started, but they show what is possible with a good, accurate map. LiDAR has worked well for mapping LSOG in the vast commercial forest of Maine, a very “contrasty” landscape with every age of forest, from clearcuts to old growth. Would it work in other parts of New England that are not so intensively managed? Maybe. The key is having known areas of true LSOG forest for training the computer. The computer then looks for other places in the landscape with the same LiDAR “fingerprint.”
Using LiDAR does require a lot of computer hard drive space. LiDAR files (called “tiles”) are huge. For example, just one hectare of LiDAR data might have 125,000 records—essentially a latitude, a longitude, and an elevation. The unorganized townships of Maine have some 430 billion records of data. However, you can work with smaller areas, as small as a single 1-km2 “tile” of LiDAR data.
In summary, as with any conservation endeavor, a good map is a game-changer for action. In the end, it will be a social question as to how much LSOG we, as a society, want to conserve. With a good map, we can now have that conversation.
Related Presentation from the Northeastern Old Growth Conference 2025
September 17-21, 2025 | Middlebury College - Bread Loaf campus | Ripton, Vermont
View all recorded presentations from the conference.
John Hagan is a forest ecologist and President of the nonprofit Our Climate Common, based in Georgetown, Maine. He has studied Maine’s working forest landscape for 33 years. For more information about the Late-Successional and Old Growth (LSOG) mapping project, see Hagan et al., 2024 . If you would like help determining whether LiDAR might be useful for your area, contact John Hagan at jhagan@ourclimatecommon.org.